Current-voltage characteristics of a single-electron transistor is non-linear due to Coulomb blockade of electron tunneling via the central metallic island, which is separated from the leads by highly resistive tunnel junctions. The characteristic energy scale of this effect is the charging energy of the island EC. At very low temperatures, kBT << EC, the current cannot flow through the SET at bias voltages below the Coulomb blockade threshold, V<2EC/e. However at high temperatures, kBT >> EC, current can easily flow through the device at any bias voltage and its current-voltage characteristics becomes linear. Thus the thermometer based on SET is sensitive in the range of temperatures from EC/ kB to, let say, 10 EC/ kB. Hence, if the thermometer is designed for high temperatures then high values of the charging energy and small size metallic islands are required. In contrast, thermometers dedicated to very low temperatures should have big islands and low charging energy.
Performance of the Coulomb blockade thermometer is improved if one uses an array of identical metallic islands connected in series instead of a single-island SET. Theory predicts [1] that for an array of N-1 islands connected to each other and to the leads by identical N tunnel junctions with resistance R and capacitance C the differential conductance has the form

In Fig. 1 we plot the differential conductance of an array of 9 islands (10 junctions) with charging energies EC/ kB= 1K for three different temperatures.
The width of the dip in the differential conductance, measured at its half-depth, is proportional to the temperature, V1/2=5.439 NkBT/e. This important property implies that Coulomb blockade thermometer is a primary thermometer.
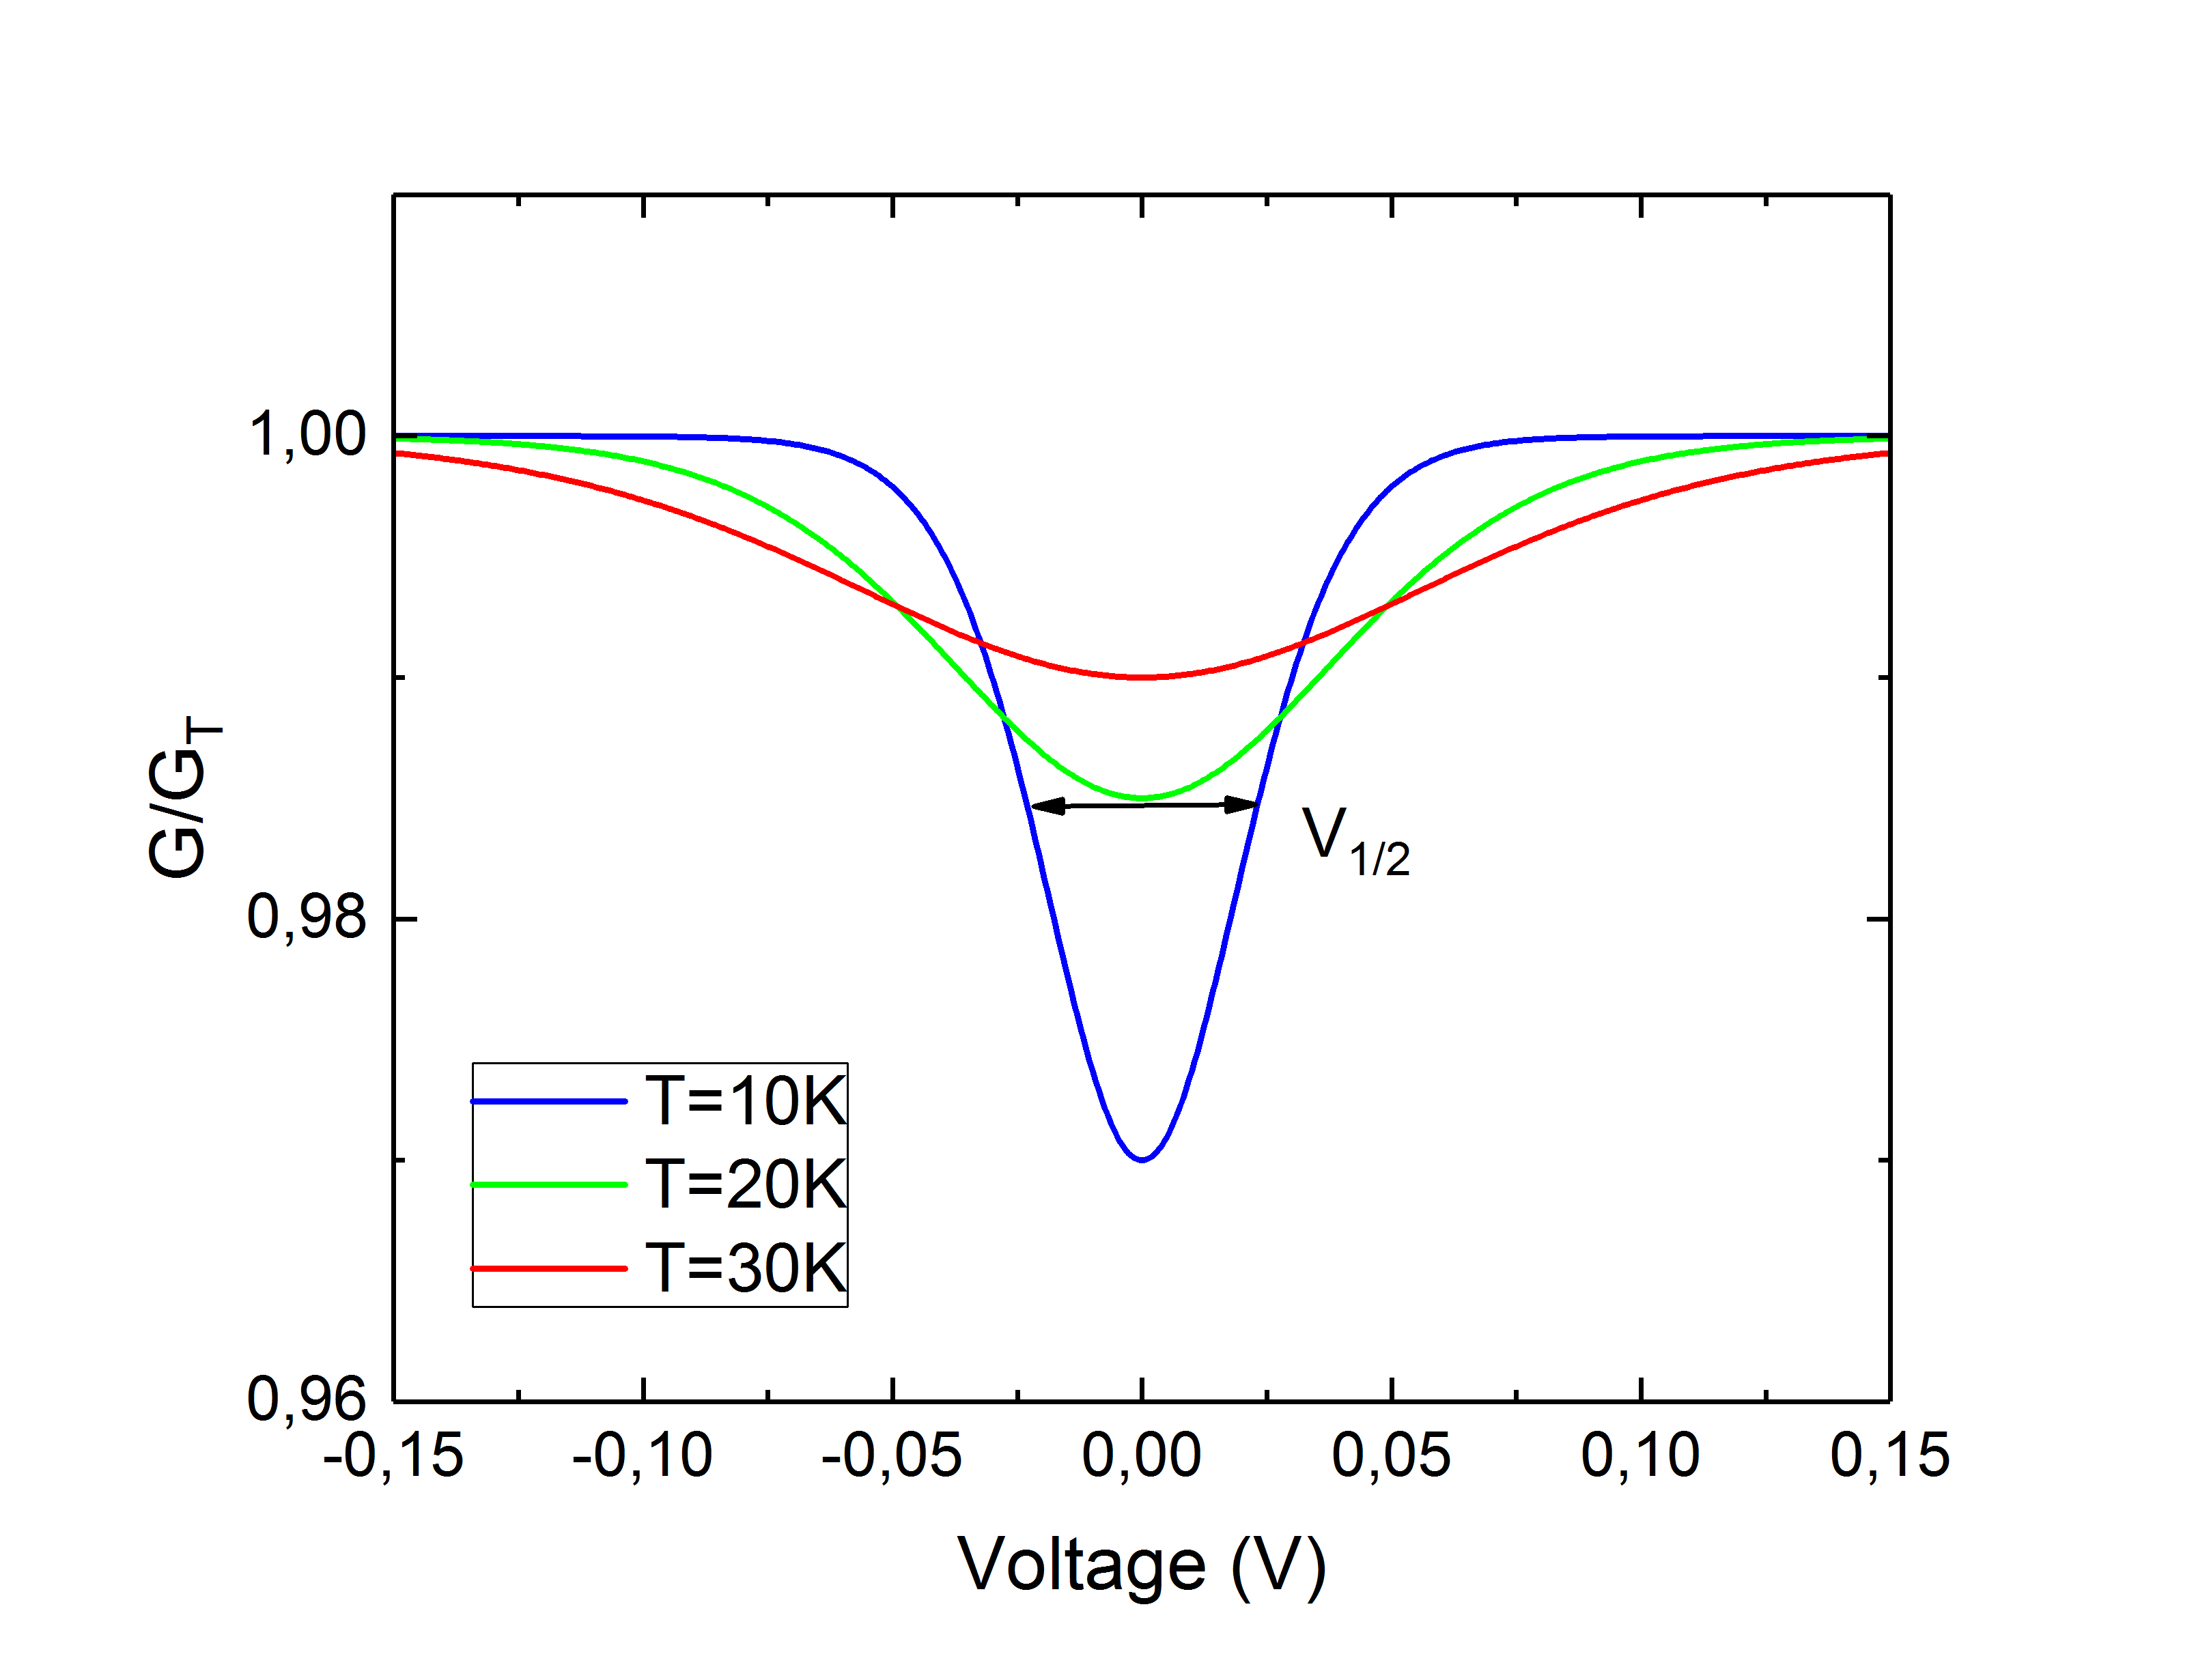
Figure 1
In the left panel of Fig. 2 we show three high quality arrays of small size 6 junctions fabricated with the suspended germanium mask [2]. These arrays operate as thermometers in the range of temperatures from 10 to 60 K with the accuracy better than 1%, see the right panel of Fig. 2.
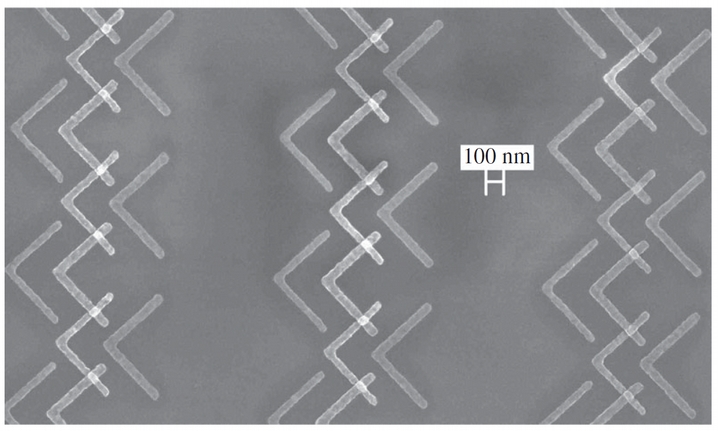
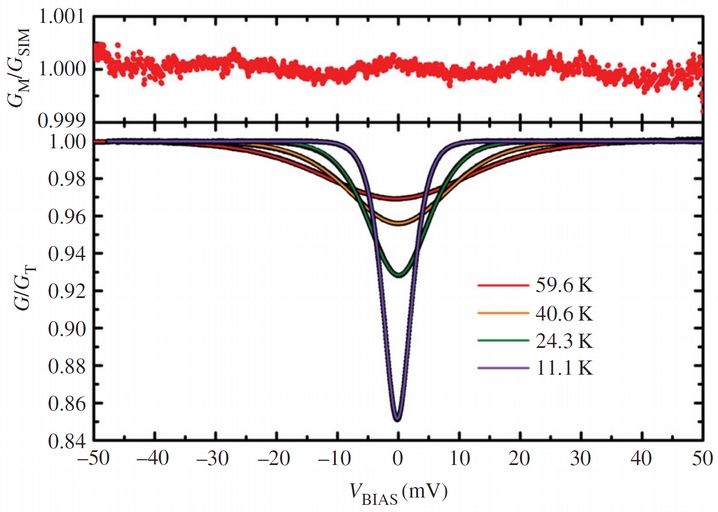
Figure 2. Left panel: three six junctions arrays. Right panel: normalized differential conductance of an array at different temperatures; right curve in the top panel is the difference between the experiment and the theory at 60 K.
[1] J.P. Pekola, K.P. Hirvi, J.P. Kauppinen, and M.A. Paalanen. Thermometry by Arrays of Tunnel Junctions, Phys. Rev. Lett. 73, 2903 (1994).
[2] M. Meschke, A.Kemppinen, andJ.P.Pekola. Accurate Coulomb blockade thermometry up to 60 kelvin, Phil. Trans. R. Soc. A 374, 20150052 (2016).