Experimental realization of a Maxwell’s Demon with a single electron
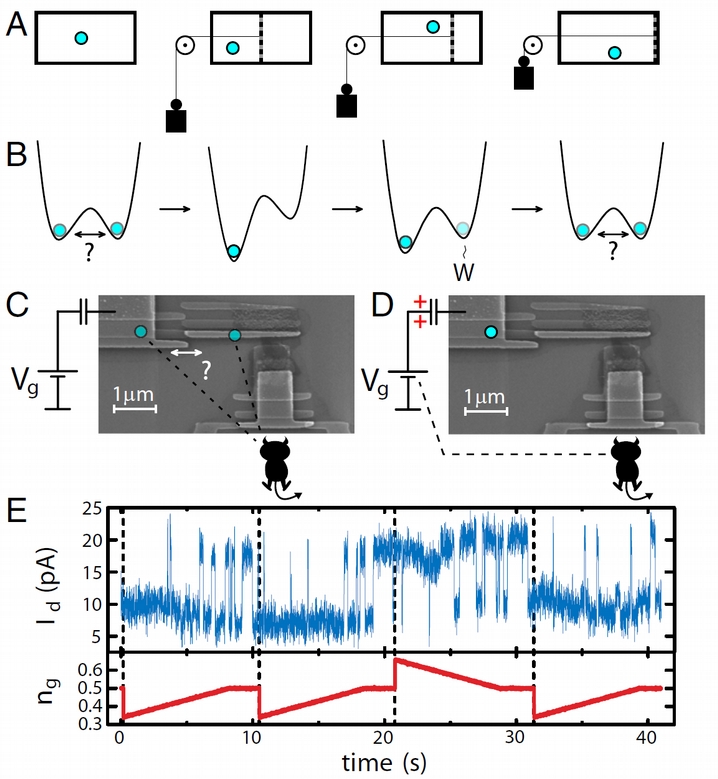
Figure 1
Maxwell’s Demon extracts the energy from a thermal bath by monitoring the microscopic state of a system and generating appropriate feedback signals based of this information. We have successfully realized [1] a Maxwell’s Demon in a very simple device – single-electron box (SEB), in which an applied gate voltage very accurately controls the number of electrons. In our realization, the SEB consists of two small metallic islands connected by a tunnel junction. The SEB is maintained at the dilution-refrigerator temperatures in the 0.1-K range. The difference of the chemical potentials between the islands is controlled by the gate voltage Vg applied to one of them. Initially, Vg is such that one extra electron is found equally likely on either of the islands (Fig. 1C). This “degeneracy point” is realized when the gate-offset charge ng = CgVg/e, where Cg is the capacitance between the gate and the SEB, is half-integer. A single-electron transistor (SET) electrometer, which can be seen in Fig. 1C and D, Bottom Right, detects which island the electron is on. Then, ng is changed rapidly to capture electron on the corresponding island by increasing the energy required for tunneling out. Finally, ng is moved slowly back to the initial degeneracy value, extracting energy from the heat bath in the process, and completing the cycle. An example of four such consecutive experimental cycles is shown in Fig. 1E. Dotted vertical lines denote the time when the measurement is performed. We observe that the feedback signal indeed locks the extra electron to the measured state, but the charge starts to hop again when ng is moved toward the degeneracy point.
We provide, to our knowledge, the first demonstration of extracting nearly kBT ln 2 of work for one bit of information.
[1] Jonne V. Koski, Ville F. Maisi, Jukka P. Pekola, Dmitri V. Averin. Experimental realization of a Szilard engine with a single electron, PNAS 111, 13786 (2014).
Stochastic Thermodynamics
Stochastic thermodynamics deals with mesoscopic systems, in which fluctuations of thermodynamic parameters play a very important role. Main examples of such systems are biological objects and electronic nanostructures. The statistics of fluctuations in such systems is governed by famous fluctuation theorem, which can be formulated in various forms.
Our group has long experience in fabricating single-electron devices, which provide an ideal test ground for stochastic thermodynamics. We fabricate single-electron boxes coupled to each other and to metallic leads by highly resistive tunnel junctions and suppress the rates of electron tunneling in such structures to the range between 1 and 1000 Hz. Connecting such structure to a single-electron transistor electrometer, we can count every electron passing through the device. In this way, we collect the full statistics of electron tunneling events, which allows us to test, for example, a fluctuation theorem or any other theoretical prediction. One of the examples is Maxwell’s demon discussed above.

Figure 2
As a second example, we will discuss the distribution of current fluctuations in a bistable conductor [2]. In this experiment we realize a controllable bistability, that causes current fluctuations in a nearby conductor. Namely, the tunneling of electrons in a single-electron box makes the conductance switch between two levels in a nearby single-electron transistor (SET) (see Fig. 2a) whose current is monitored in real time, Fig. 2b. With this setup, we can accurately measure the distribution of current fluctuations in a bistable conductor (SET), including the exponentially rare fluctuations in the tails. For this system, theory predicts that the logarithm of the current probability distribution should have the characteristic shape of a tilted ellipse. Our measurements confirm that with high accuracy, see Fig. 2c. Another theoretical prediction is the fluctuation theorem for the current distribution P. For this particular system it can be formulated in the form
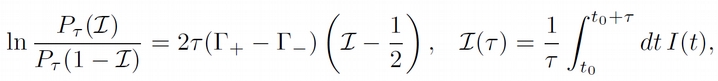
where τ is the observation time, and Γ± are the rates of switching between low and high current values. Also this prediction is fully confirmed by our experiment, see Fig. 3.
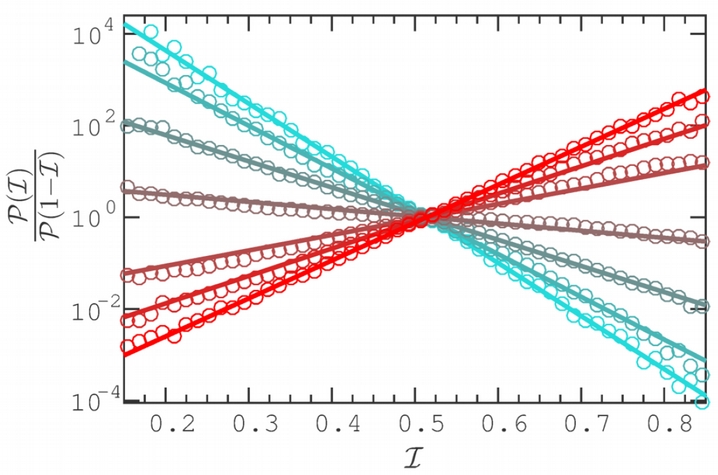
Figure 3
[2] S. Singh, J. T. Peltonen, I. M. Khaymovich, J. V. Koski, C. Flindt, and J. P. Pekola. Distribution of current fluctuations in a bistable conductor, Phys. Rev. B 94, 241407(R) (2016).